
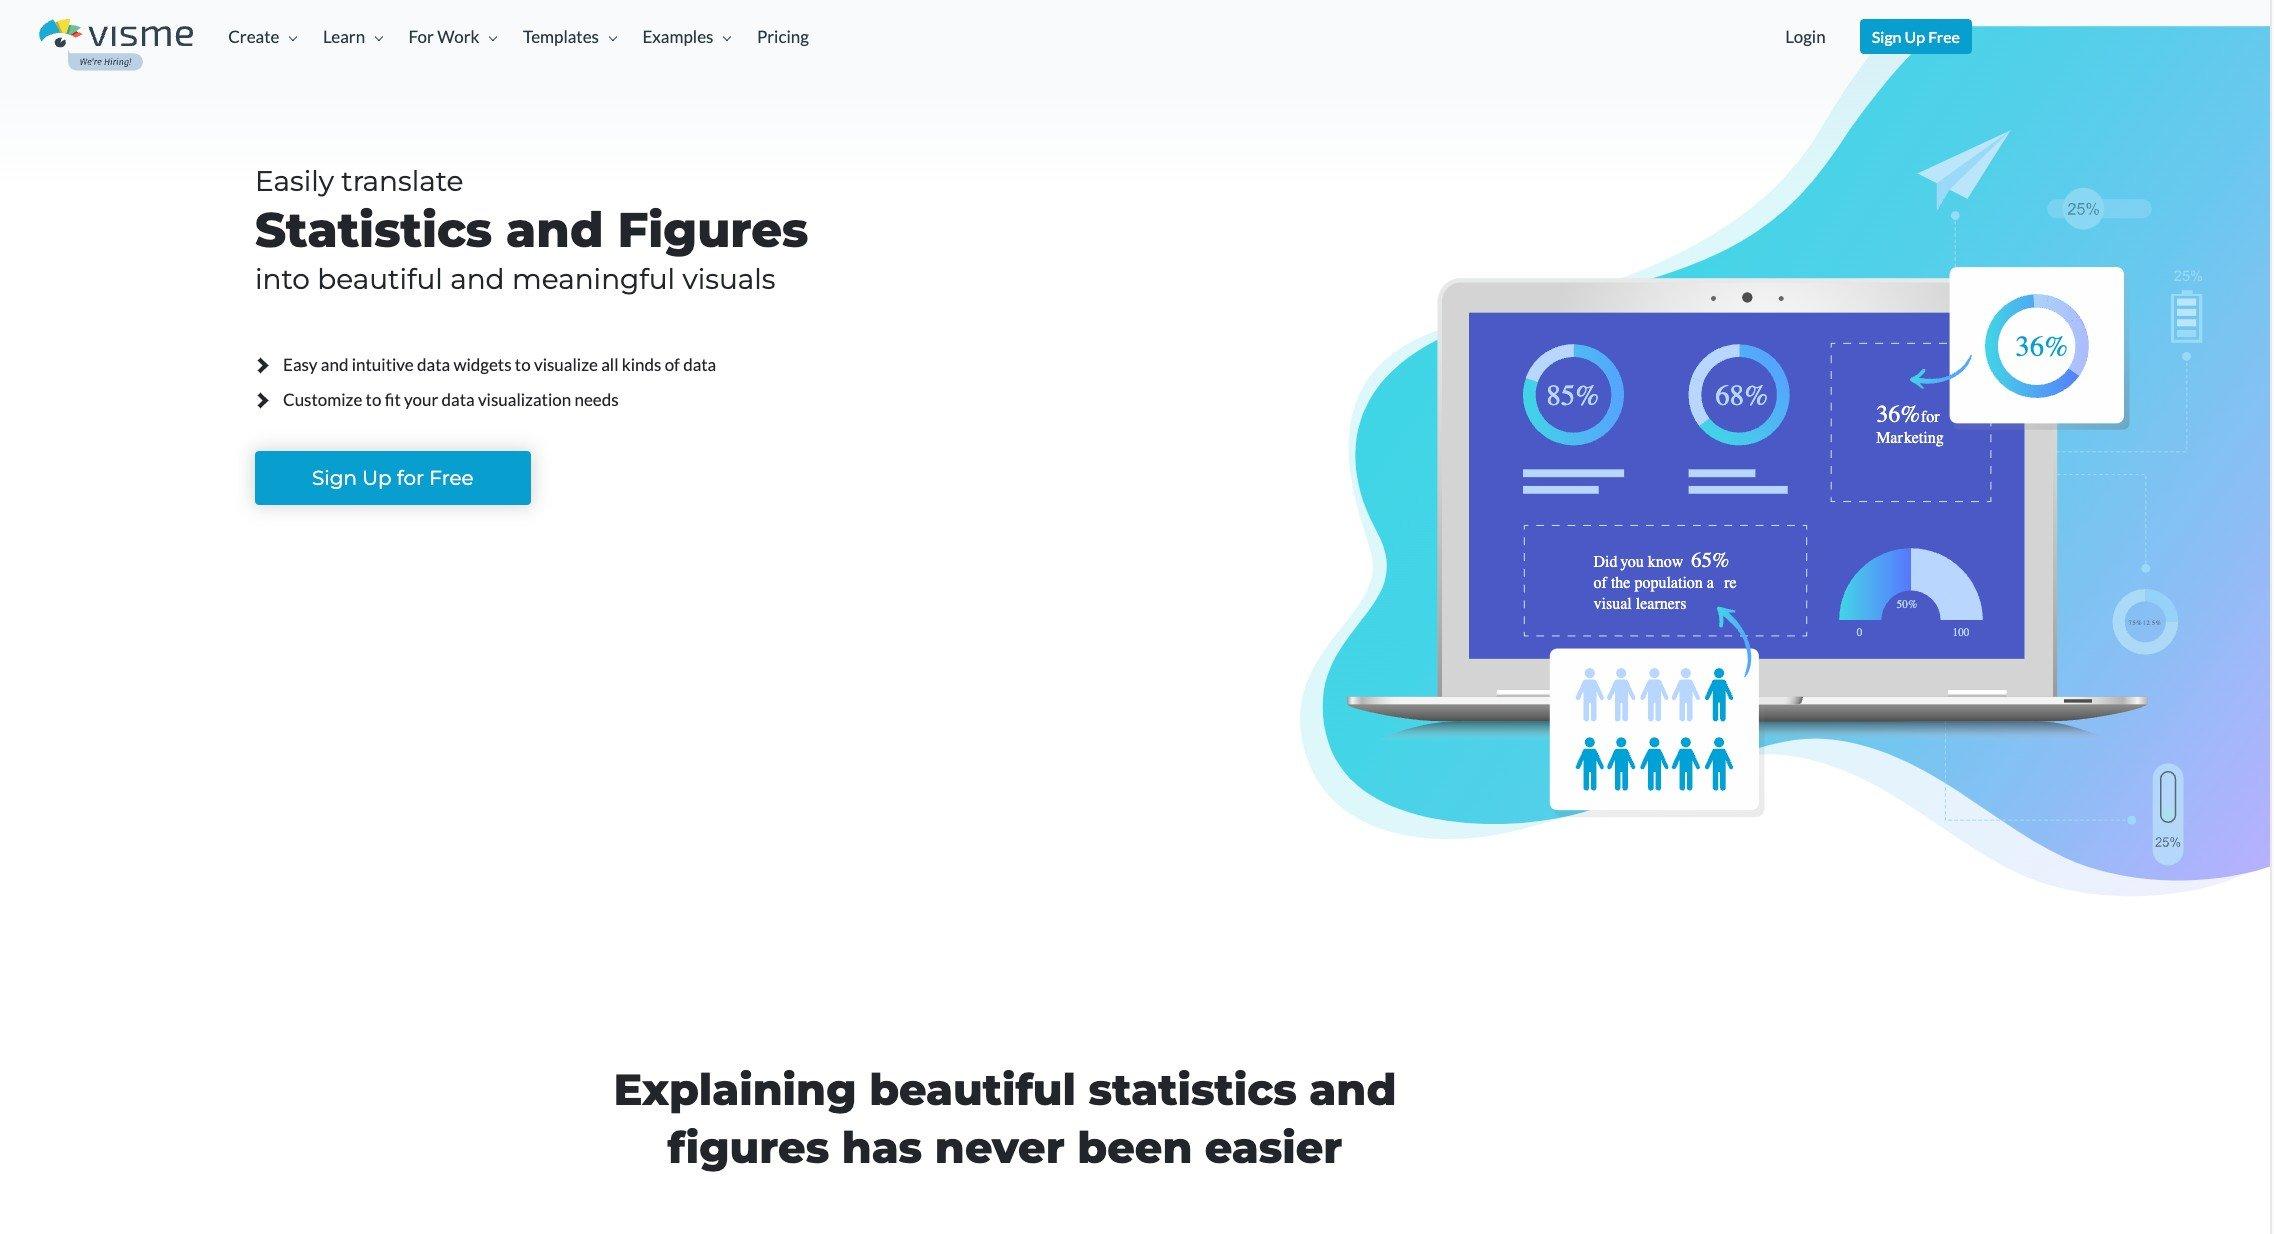
Data Visualisation Specialist in EdTech: Key Roles, Skills, and Career Opportunities
As the education sector continues to embrace technology, universities, colleges, and schools are seeking experts who can turn data into actionable insights. The role of a Data Visualisation Specialist in EdTech has rapidly gained prominence as institutions realise the power of informed decisions driven by data. Whether you’re a recent graduate, tech enthusiast, or an education professional looking for a new career path, this comprehensive guide will help you understand what it takes to thrive in this exciting and impactful role.
Why Data Visualisation Matters in Education technology
Data visualisation plays a pivotal role in EdTech, enabling teachers, administrators, and policymakers to interpret large volumes of data quickly and accurately. From tracking student progress to measuring institutional outcomes, effective data visualisation helps translate complex statistics into intuitive frameworks that support evidence-backed decisions in educational environments.
- Enhancing academic performance: visual analytics identify student learning gaps and support targeted interventions.
- Streamlining governance: Dashboards simplify the monitoring of attendance, engagement metrics, and resource allocation.
- Informing strategy: Graphs and reports help schools strategize curriculum improvements and technology adoption.
Core Responsibilities of a Data Visualisation Specialist in EdTech
The role demands both technical proficiency and a deep understanding of educational objectives. here are some key responsibilities:
- Data Collection & Cleaning: Gathering education-related data from multiple sources, ensuring accuracy and consistency.
- analysis & Insight Generation: Applying analytical models to draw meaningful conclusions about student performance, curriculum effectiveness, and institutional operations.
- Designing Visual Dashboards: Creating interactive dashboards and data visualisation tools using platforms like Tableau, Power BI, or Google Data Studio.
- Collaboration with Stakeholders: working closely with educators, administrators, and IT departments to deliver actionable reports and recommendations.
- Training & Support: Conducting workshops and support sessions to help staff interpret and leverage visual data for decision-making.
Essential Skills for Data Visualisation Specialists in Education Technology
Landing a job as a Data Visualisation Specialist in EdTech requires a blend of hard and soft skills:
Technical Skills
- Data Analysis: Competence in statistical methods,data mining,and predictive analysis.
- Programming Languages: Proficiency in Python, R, and SQL for data manipulation and automation.
- Visualisation Tools: Expertise in Tableau, Power BI, Google Data Studio, D3.js, or other popular platforms.
- Database Management: Familiarity with relational databases (MySQL, PostgreSQL) and cloud-based solutions.
- Data Security: Understanding privacy laws (FERPA, GDPR) relevant to educational contexts.
Soft Skills
- Dialog: Ability to translate complex data into accessible insights for diverse audiences.
- Problem Solving: Innovative thinking in transforming raw data into useful narratives.
- Attention to Detail: Precision in designing visually compelling and error-free representations.
- Project Management: Overseeing analysis projects from conception to presentation.
- Collaboration: Effective teamwork with IT, academics, and administrative staff.
career Opportunities for Data Visualisation Specialists in EdTech
The growth of educational technology has created abundant openings for specialists in data visualisation. Here’s where you might find employment:
- Universities and Colleges: assisting institutional research departments, digital learning initiatives, and academic analytics offices.
- K-12 Schools: Supporting school districts with performance dashboards and curriculum evaluation.
- Online Education Providers: Enhancing virtual learning environments with user engagement analytics.
- EdTech Companies: Developing products that help schools visualise data for better outcomes.
- Consultancy Services: Advising educational institutions on best practices in data management and reporting.
Typical Job Titles in edtech Data Visualisation
- Data Visualisation Specialist
- Educational Data Analyst
- Business Intelligence Analyst – Education
- Learning Analytics Coordinator
- EdTech Dashboard Designer
Benefits of Being a Data Visualisation Specialist in Education Technology
Choosing this career path comes with several unique advantages, both professionally and personally, especially within the dynamic EdTech sector:
- High Demand: Educational institutions are investing heavily in data-driven solutions, increasing the need for visualisation experts.
- Career Growth: Opportunities to advance into management roles or specialize further in data science,AI,and learning analytics.
- Impactful Work: Directly contribute to student success and institutional enhancement.
- continuous Learning: Stay ahead with evolving technologies, visualisation techniques, and sector trends.
- Collaborative Surroundings: Work alongside educators, technology leaders, and administrators passionate about innovation.
Practical Tips for Landing a Job as a Data Visualisation Specialist in edtech
Ready to pursue a rewarding career in educational data visualisation? Use these actionable tips to boost your employability and stand out among job seekers:
1. Build a Strong Portfolio
- Create sample dashboards and data stories using educational datasets.
- Showcase your work on a personal website or professional platforms (e.g., LinkedIn).
2. Earn Relevant Certifications
- Pursue certifications in data visualisation, analytics, or EdTech software (Tableau, Power BI, etc.).
- Consider professional progress courses in data privacy and pedagogy.
3. Gain Practical Experience
- Volunteer with local schools, universities, or EdTech startups.
- Participate in hackathons,research projects,and open data challenges.
4. Network with Industry Professionals
- Join LinkedIn groups and attend EdTech conferences.
- Engage with educational data communities for mentorship and updates.
5. Tailor Your Resume and Cover Letter
- Highlight experience with education data, visualisation tools, and collaborative projects.
- Quantify your impact using metrics—for example, “Improved student retention rates by 10% with targeted dashboards.”
Future Trends in Data Visualisation for EdTech
The field of data visualisation in education is evolving fast. As institutions collect more granular data about teaching, learning, and administration, specialists must adapt to new challenges and opportunities. look out for:
- Artificial Intelligence Integration: AI-driven analytics and predictive visualisation models are streamlining personalized learning pathways.
- Mobile & Cloud Solutions: Responsive dashboards for smartphones and seamless cloud integration are making data accessible to teachers and students.
- Interactive Learning Analytics: Data visualisation tools now incorporate real-time tracking and feedback features for educators and learners alike.
- Inclusive Design: Visualisations are being optimized for accessibility, ensuring all users benefit from data insights.
Conclusion: Your Path to Making an Impact in education Technology
As a Data Visualisation Specialist in EdTech, you have the chance to blend your technical expertise with a passion for education, making a tangible difference in how institutions operate and how students learn. By mastering core skills, staying updated with the latest tools, and understanding the sector’s needs, you’ll find diverse and fulfilling career opportunities in universities, colleges, schools, and EdTech companies. The future of education is powered by data—and you could be a key player in shaping that future. Start your journey now by building your skills,portfolio,and network in the rapidly growing EdTech data visualisation field.