
How to Measure the Real Impact of Bite-Sized Learning: Key Metrics & Strategies
Bite-sized learning, also known as microlearning, has revolutionized the way we approach employee development, eLearning, and personal growth initiatives. By delivering content in small, focused units, bite-sized learning promises enhanced engagement and improved retention. But how do you measure the real impact of bite-sized learning? What are the right metrics and effective strategies? In this guide, we’ll break down practical approaches, core metrics, proven benefits, and real-world examples to help you measure and maximize the effectiveness of yoru bite-sized learning programs.
Table of Contents
- What is Bite-Sized Learning?
- Why Measure the Impact of Bite-Sized Learning?
- Key metrics to Measure Bite-Sized Learning Impact
- Strategies for Measuring Microlearning Effectiveness
- Benefits of Tracking Bite-Sized Learning
- Case Studies & First-Hand Experience
- Practical Tips for Optimizing Your Measurement Approach
- Conclusion
What is Bite-Sized Learning?
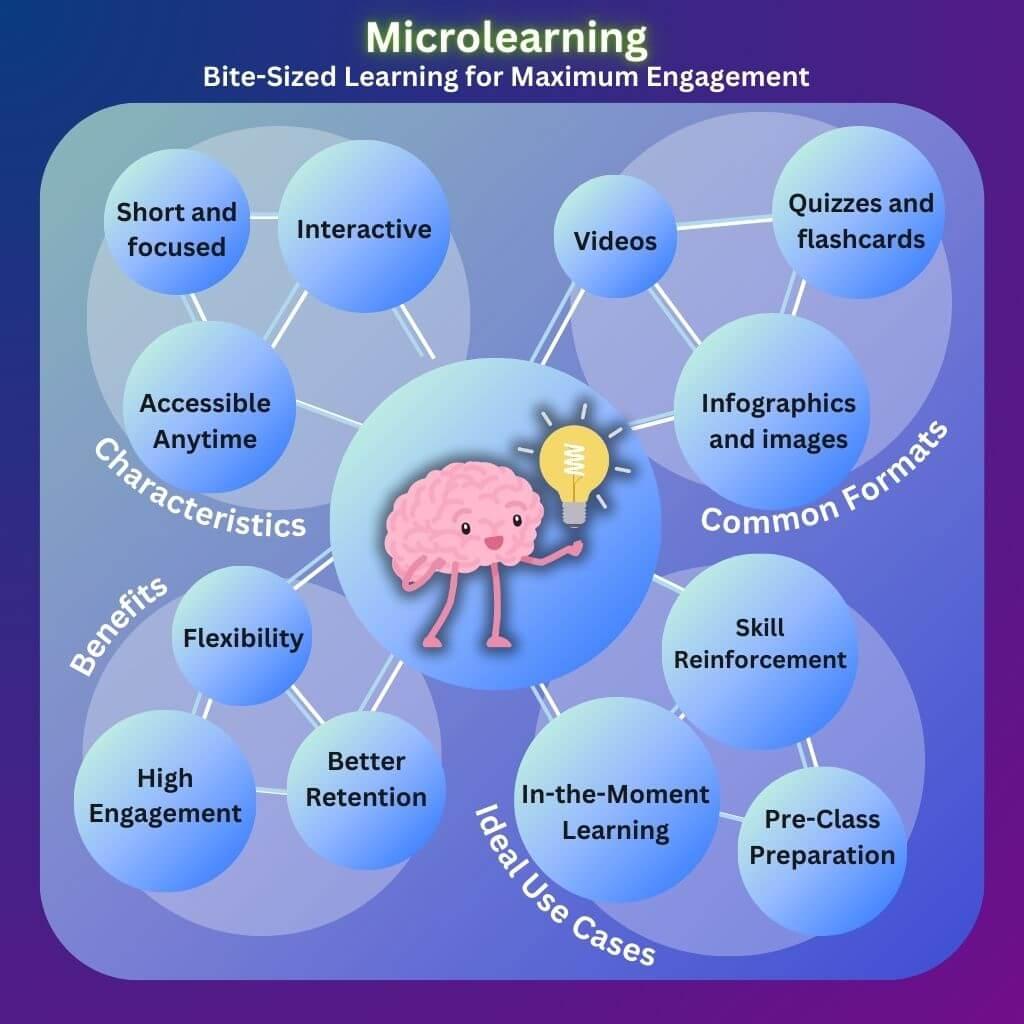
bite-sized learning refers to delivering educational content in small, easily digestible chunks. This method is prevalent in modern eLearning, workplace training, and continuous professional development. Each module or lesson typically takes 3–7 minutes, focusing on one key concept or skill.
- Accessible on-demand, wherever and whenever needed
- Well-suited for mobile learning and remote teams
- Multiple formats: videos, quizzes, infographics, podcasts, flashcards
Why Measure the Impact of Bite-Sized Learning?
While microlearning is known for its versatility and engagement, measuring its real impact is essential to ensure ROI, improve learning outcomes, and fine-tune your strategy. without clear data, organizations risk investing in approaches that may not deliver the expected results.
- Pinpoint strengths and weaknesses in your learning content
- Link learning activities directly to business objectives
- Refine content and delivery to maximize knowledge retention
- Demonstrate value to key stakeholders and leadership
Key Metrics to Measure Bite-Sized Learning Impact
To accurately assess the effectiveness of microlearning, it’s critical to track a blend of qualitative and quantitative metrics. Here are the best metrics to start wiht:
1. Completion Rates
- What it measures: The percentage of learners who complete modules or lessons.
- Why it matters: High completion rates suggest content is engaging and accessible. Low rates can signal delivery or design issues.
2. Engagement Scores
- Includes: Time spent on content, number of interactions, participation in quizzes or discussions.
- Platform insight: Use your LMS or analytics tools to monitor activity levels.
3. Knowledge Retention
- Methods: Pre- and post-assessments, knowledge check quizzes, scenario-based tests.
- The goal: determine how much information is retained over time.
4. Request of Knowledge
- Real-world impact: Are learners applying new skills or knowledge on the job?
- Measuring tools: On-the-job assessments, performance reviews, self-reported application surveys.
5. Learner Satisfaction
- Surveys, feedback forms, Net Promoter Score (NPS)
- Qualitative data on user experience, perceived value, and content clarity
6. Business KPIs & Outcomes
- Direct impact on key performance indicators, such as sales numbers, productivity, customer satisfaction, or error reduction rates.
- Monitor improvements in operational metrics post-training implementation.
Strategies for Measuring Microlearning Effectiveness
To measure the real impact of bite-sized learning, combine multiple data sources and methods for a holistic view.
Adopt a Learning Analytics Framework
- Kirkpatrick Model: Evaluate at four levels: Reaction, Learning, Behavior, and Results.
- Phillips ROI Methodology: Add a fifth level to Kirkpatrick—return on investment.
Integrate Your LMS
- Leverage built-in analytics to capture completion, engagement, and assessment data.
- Automate report generation for real-time insights.
Use Pulse surveys & Feedback Tools
- Short, recurring surveys provide immediate feedback and highlight trends in learner confidence and satisfaction.
- Integrate fast polls into microlearning units for instant response rates.
Correlate Learning Data with Business Results
- link training data with performance management tools to attribute changes in KPIs directly to learning activities.
- Segment data by role, department, or location for granular analysis.
Benefits of Tracking Bite-Sized Learning Impact
Measuring bite-sized learning extends beyond proof of concept.Regular tracking delivers strategic advantages, such as:
- Continuous improvement—Iteratively update content to better meet learner needs.
- Personalization—Adapt recommendations and learning paths based on historic engagement and outcomes.
- Evidence-based decision making—Empower L&D teams with actionable insights for future investments.
- Stronger learner engagement—Data-driven optimization encourages ongoing participation.
Case Studies & First-Hand Experience
Let’s look at real-world organizations that have leveraged bite-sized learning and measured its impact effectively.
Case Study: Global Retailer Boosts Sales Performance
- Situation: A leading retail company rolled out microlearning courses on upselling and customer service skills for front-line staff.
- Measurement: Tracked completion and knowledge checks, compared sales metrics before and after training.
- Results: Saw a 30% lift in average transaction value and a 50% increase in customer satisfaction scores three months post-implementation.
Case Study: Tech Firm Cuts Onboarding Time
- Situation: A technology company adopted bite-sized learning for new hire onboarding,breaking up compliance,and role-specific training into micro modules.
- Measurement: Used LMS analytics and employee feedback surveys.
- Results: Reduced time-to-competency by 40%, with new hires reporting higher satisfaction and confidence in their roles.
first-Hand Insight
As an L&D consultant, conducting regular pulse surveys after deploying microlearning modules revealed patterns in user preferences (e.g., short videos outperforming text-based units). Data also highlighted the importance of linking each module’s learning objectives to measurable outcomes, such as specific productivity improvements.
practical Tips for Optimizing Your Measurement approach
To make your measurement strategies for bite-sized learning truly effective, follow these actionable tips:
- Define Objectives Early: Tie each microlearning module to a clear, measurable outcome (e.g., improve customer service ticket closure time by 10%).
- Use Baseline data: Gather pre-training data to serve as a comparison point for post-training analysis.
- Automate Data Collection: Use your LMS, HRIS, or integration tools to reduce manual work and ensure consistency.
- Encourage Qualitative Feedback: Open-ended surveys and interviews can provide insights missed by quantitative metrics alone.
- Iterate Quickly: Short module lengths mean you can easily refine and redeploy content based on real-time data.
- Promote a Feedback Culture: Let learners know their input directly influences learning improvements—thay’ll be more engaged if they feel heard.
- Integrate with Performance Management: where possible, automate connection between learning and business outcomes for seamless reporting.
Conclusion
Measuring the real impact of bite-sized learning empowers organizations to deliver more engaging, effective, and business-aligned training. By combining core metrics such as completion rates, engagement scores, and business outcomes with robust analytics frameworks, L&D leaders can fine-tune their digital learning strategies for maximum ROI. Start with clear objectives, leverage the right tools, and consistently gather both quantitative and qualitative feedback—your bite-sized learning initiatives will thrive, creating measurable gains in both skill development and business performance.