
Top Skills & Career Path for a Data Visualisation Specialist in EdTech
Are you passionate about turning data into insight and making a difference in the education sector? The role of a Data Visualisation Specialist in EdTech offers an exciting and rewarding career path for individuals interested in education technology within universities,colleges,and schools. In this comprehensive guide, we’ll explore the top skills, career trajectory, daily responsibilities, and benefits of working as a data visualisation specialist in EdTech, along with practical tips to help you land your ideal job.
Introduction: The Power of Data Visualisation in Education Technology
Education technology (EdTech) is transforming learning and administration across academic institutions. With the increasing emphasis on data-driven decision making, Data Visualisation Specialists have become highly sought-after professionals. They play a pivotal role in converting complex educational data into meaningful, actionable visuals that support curriculum design, student performance analysis, and institutional strategy.
Whether you’re looking to enhance instructional outcomes or improve operational efficiency, a career in data visualisation within EdTech puts you at the intersection of technology, education, and analytics.
What Does a Data Visualisation Specialist in EdTech Do?
The core responsibility of a Data visualisation Specialist is to present educational data in accessible and engaging ways for stakeholders. These specialists work closely with administrators, educators, IT teams, and sometimes students, to:
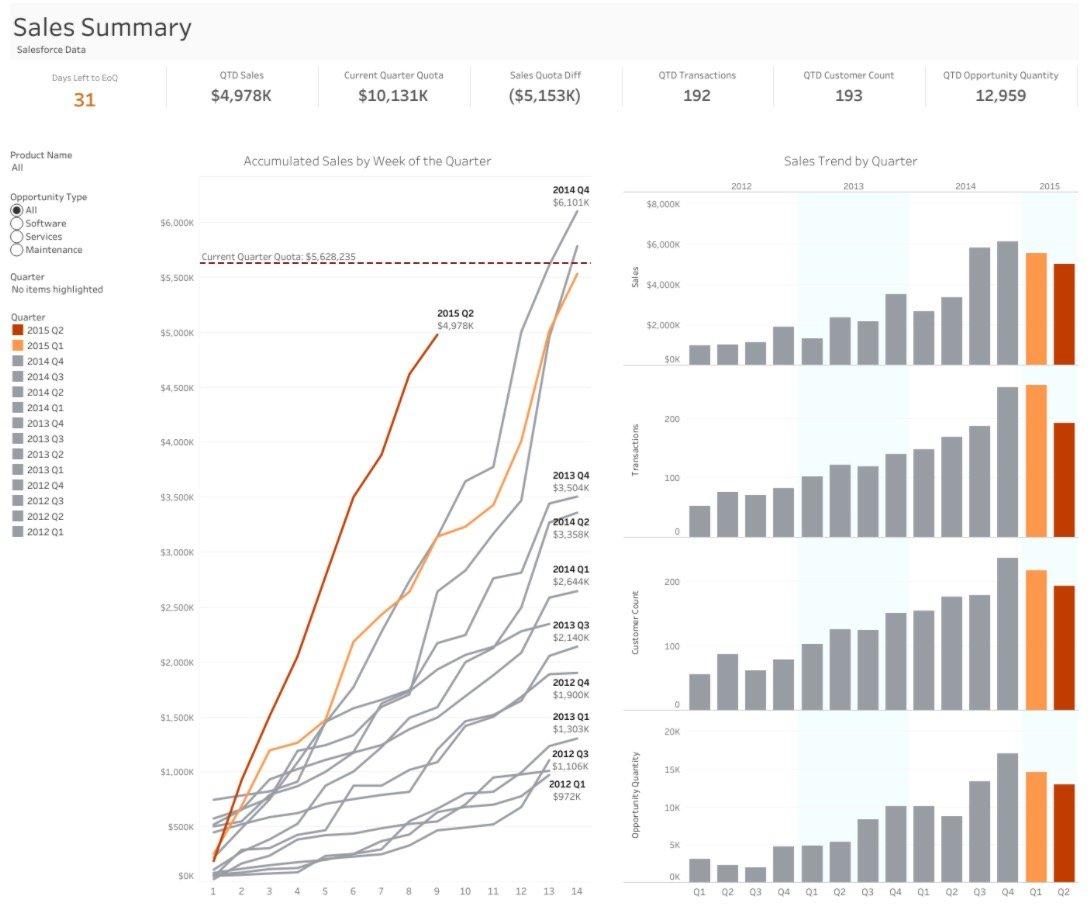
- Design dashboards that monitor student progress, digital learning engagement, and resource utilization.
- create interactive reports for university or school leaders to drive data-based strategies.
- Support curriculum development by visualizing assessment results and learning analytics.
- Assist with accreditation and compliance reporting through clear, accurate data presentations.
- Enhance faculty development by highlighting trends and anomalies in teaching or student performance data.
In essence, they turn raw data into visual stories that drive better outcomes for learners and institutions alike.
Top Skills Needed for Data Visualisation Specialists in EdTech
if you’re aiming to excel as a Data Visualisation Specialist in education technology at a university, college, or school, there is a blend of technical and soft skills you should develop:
1. Data Analysis & Statistical Skills
- Data cleaning and pre-processing: Manage raw/unclean data efficiently.
- Statistical analysis: Understand trends, outliers, and importance, crucial for academic data sets.
- Educational measurement: Familiarity with test scores, student engagement metrics, and institutional KPIs.
2.Data Visualisation Tools Proficiency
- tableau: widely used in both academic and corporate settings for interactive dashboards.
- Power BI: Increasingly popular in schools and universities for integrating multiple datasets.
- excel: Advanced excel skills (pivot tables, charts, VBA) remain crucial.
- D3.js, Google Data Studio, or Python libraries (Matplotlib, Seaborn): For custom visualizations and automation.
3. Programming Skills
- Python: For data cleaning,processing,and advanced analytics (pandas,numpy,matplotlib).
- R: especially for statistical analysis in education research projects.
- SQL: Access and manipulate large institutional databases.
4. Communication & Storytelling
- Translate complex data findings into clear narratives for non-technical stakeholders.
- Create compelling presentations and data stories for educators and decision-makers.
5. Understanding of EdTech Platforms & Academic Data
- Familiarity with learning Management Systems (LMS) like Canvas, Blackboard, or Moodle.
- Knowledge of educational standards, FERPA requirements, and ethical data handling.
- Experience working with student data systems and e-learning analytics.
6. Project Management & Collaboration
- Work cross-functionally with IT, administration, and academic teams.
- Strong organization skills for managing multiple projects with varying deadlines.
Career Path for a Data Visualisation Specialist in EdTech
The career trajectory for data visualisation experts in education technology is vibrant and evolving. Here’s a typical path you might follow:
- Junior Data Analyst / Assistant Data Visualisation Specialist
- Entry-level data tasks (cleaning, basic charts, assisting with dashboard readiness).
- Develop foundational skills with data tools and educational data sets.
- Data Visualisation Specialist
- Design and maintain dashboards and reports for various stakeholders.
- Involve in education-focused analytics projects for curriculum or administration.
- Senior Data Visualisation Specialist / Data Analytics Lead
- Lead major data projects, mentor junior colleagues.
- Present strategic findings to institutional leadership.
- Analytics Manager or Director of Institutional Research
- Oversee analytics teams or departments within a university, college, or school system.
- Help shape data-driven strategy and innovation in education technology.
- chief Data Officer or Head of Educational Data Science
- Decision-making roles impacting institution-wide policies and academic outcomes.
Some specialists also branch into roles such as EdTech Consultants, Learning Analytics Specialists, or move into product-focused roles for EdTech companies developing analytical platforms.
benefits of Working as a Data Visualisation Specialist in EdTech
Pursuing a career as a data visualisation specialist in education technology comes with numerous personal and professional rewards,including:
- Making a difference: Your insights directly impact student learning,retention,and institutional success.
- Continuous learning: stay at the forefront of both data analytics and educational trends.
- Diverse career opportunities: Work in universities, colleges, K-12 schools, or EdTech startups.
- Job security and growth: Demand is rising for data-savvy professionals in education.
- Hybrid/remote work potentials: Many institutions support flexible working arrangements for data roles.
Practical Tips: How to land a data visualisation Job in EdTech
Breaking into education technology as a data visualisation specialist may feel daunting, but these actionable steps can help set you up for success:
- Build a Portfolio:
- Showcase dashboards, interactive reports, and data stories relevant to education.
- Include anonymized data from online datasets, or offer to volunteer with educational non-profits.
- Gain Relevant Experience:
- Apply for internships or assistant roles in university research offices, institutional research, or EdTech firms.
- Earn Certifications:
- Pursue certifications in Tableau, Power BI, or related analytical tools.
- Consider further study in data science or educational measurement.
- Network with EdTech Professionals:
- Join linkedin groups, attend education technology conferences, or participate in online forums.
- Stay Updated:
- Follow trends in both data visualisation and EdTech practices.
- Understand the Academic Calendar:
- Academic hiring often peaks between February and May for the next school year, so plan your applications accordingly.
- Tailor Your Resume:
- Highlight education data projects,knowledge of FERPA,and your ability to communicate technical results to non-technical staff.
Conclusion: Shaping the future of Education through Data Visualisation
As a Data Visualisation Specialist in EdTech, you can be a powerful agent of change, helping institutions harness their data for student-centered and evidence-based decisions. Combining technical expertise with a passion for educational impact unlocks many career possibilities in universities,colleges,and schools.
If you are analytical, creative, and eager to see your work make a difference, this path offers both meaning and growth. Now’s the perfect time to build your portfolio, master the necessary skills, and become a valued contributor to the rapidly evolving world of education technology.